How Much Sugar Is in Your Fruit?
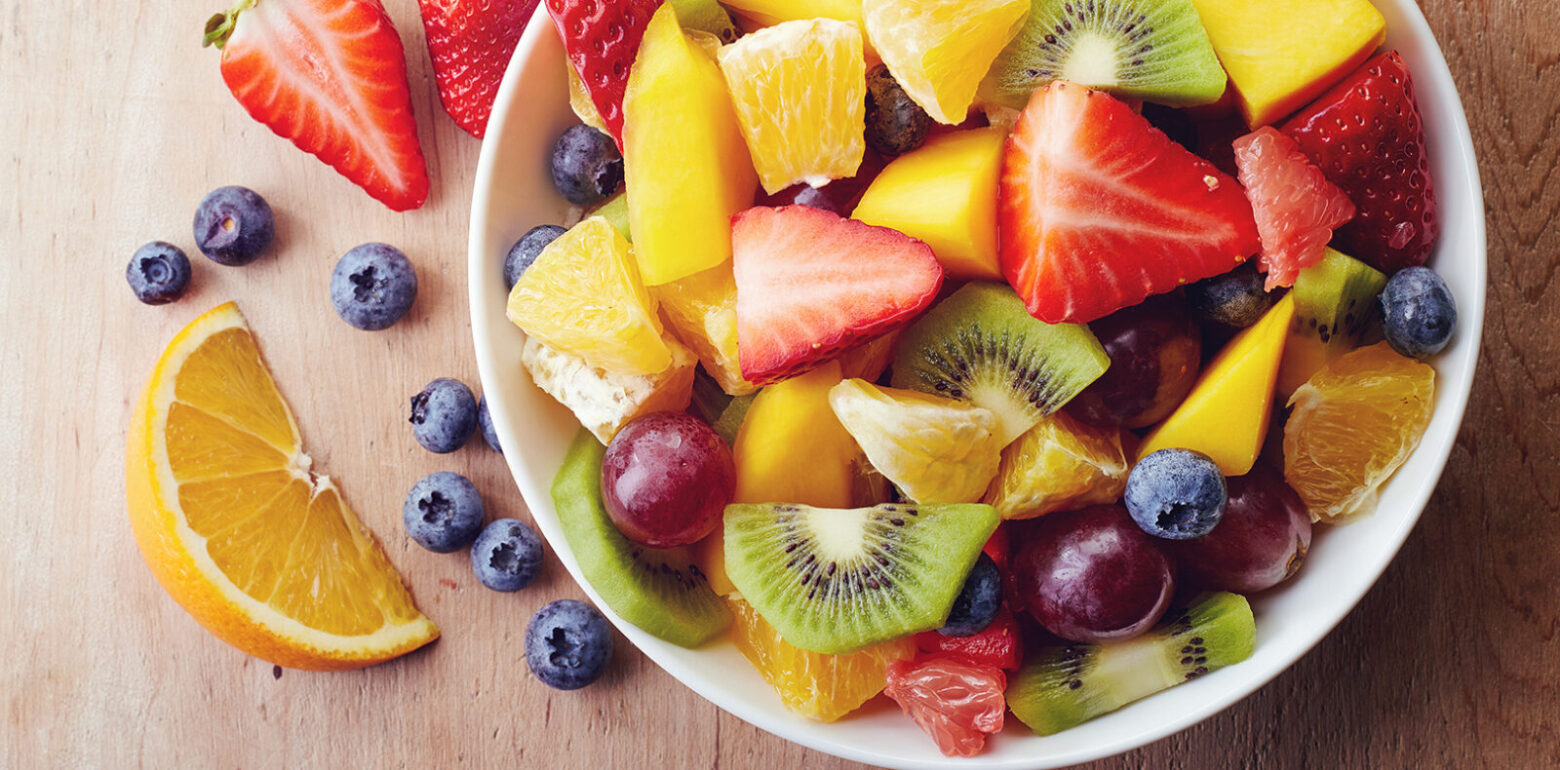
Fresh fruits are healthy, nutritious foods that are good sources of vitamins, minerals, phytochemicals, and fiber. Plus, they’re instrumental in maintaining a net alkaline-yielding diet. So should you worry about the sugar content in your fruit?
Generally, the answer is no. Fruit contains a good amount of fiber and seeds that lower the glycemic load from the sugars contained in fruit. As a result, eating whole fruit helps keep blood sugar normalized.
However, it’s important to note that the common fruits we eat today have little resemblance to their wild ancestors. Domesticated fruits are almost always larger, sweeter, and contain less fiber than their wild counterparts. Compare a Golden Delicious apple to a crab apple, and you get the idea!
Should I Limit Fruit if I’m Overweight?
The Paleo Diet founder Dr. Loren Cordain recommends that most people eat fresh fruit as their appetite dictates. However, if you are overweight or insulin-resistant, he recommends that you initially limit your consumption of high-sugar fruits, like grapes, bananas, mangos, sweet cherries, apples, pineapples, pears, and kiwis.
If you are overweight, a good rule of thumb is to avoid eating fruits with high sugar content until your weight starts to normalize and your health improves. Instead, try to eat more vegetables.
Note that some fruits, like avocados, lemons, and limes, are very low in total sugar and don’t need to be restricted.
Can I Eat Fruit If I’m Insulin Resistant?
If you’re insulin-resistant, eating fructose may be particularly problematic.
Take a look at the table below. It’s important to know that in the gut, table sugar (or sucrose) is split into two parts before it enters the bloodstream: fructose and glucose. That’s why sucrose’s contribution to the total dietary fructose load must be considered.
Beware of Dried Fruits!
You’ll also want to take note of the high levels of sugar dried fruits contain. As you can see from the table below, dried fruits more closely resemble commercial candy than fresh, whole fruit.
For example, Zante currants have 70 grams of sugar, while Milk Duds contain only 50 grams!
Most fresh fruits fall way below those numbers, as you can see in our Fruits and Their Sugar Content table below.
Foods and Their Sugar Content
| In grams (g) | Total Sugars | Glucose | Galactose | Fructose | Sucrose | Lactose | Maltose | Tot. Met. Fructose |
|---|---|---|---|---|---|---|---|---|
| Apples | 13.3 | 2.3 | 7.6 | 3.3 | 9.3 | |||
| Apricots | 9.3 | 1.6 | 0.7 | 5.2 | 3.1 | 3.3 | ||
| Avocado, California | 0.9 | 0.5 | 0.2 | 0.1 | 0.3 | |||
| Avocado, Florida | 0.9 | 0.5 | 0.2 | 0.1 | 0.3 | |||
| Banana | 15.6 | 4.2 | 2.7 | 6.5 | 6 | |||
| Bit O Honey | 42.4 | 5 | 0.5 | 27 | 2.5 | 5 | 14 | |
| Blackberries | 8.1 | 3.1 | 4.1 | 0.4 | 4.3 | |||
| Blueberries | 7.3 | 3.5 | 3.6 | 0.2 | 3.7 | |||
| Brown sugar | 89.7 | 5.2 | 84.1 | 42.1 | ||||
| Cantaloupe | 8.7 | 1.2 | 1.8 | 5.4 | 4.5 | |||
| Casaba melon | 4.7 | 0.3 | 0 | |||||
| Cherries, sour | 8.1 | 4.2 | 3.3 | 0.5 | 3.6 | |||
| Cherries, sweet | 14.6 | 8.1 | 6.2 | 0.2 | 1.3 | 6.3 | ||
| Dates | 64.2 | 44.6 | 22.3 | |||||
| Dried apricots | 38.9 | 20.3 | 12.2 | 6.4 | 15.4 | |||
| Dried figs | 62.3 | 26.9 | 3.9 | 24.4 | 6.1 | 27.5 | ||
| Dried mango | 73 | |||||||
| Dried papaya | 53.5 | |||||||
| Dried peaches | 44.6 | 15.8 | 15.6 | 13.2 | 22.2 | |||
| Dried pears | 49 | |||||||
| Dried prunes | 44 | 28.7 | 14.8 | 0.5 | 15.1 | |||
| Elderberries | 7 | |||||||
| Figs | 6.9 | 3.7 | 2.8 | 0.4 | 3 | |||
| Grapefruit, pink | 6.2 | 1.3 | 1.2 | 3.4 | 2.9 | |||
| Grapefruit, white | 6.2 | 1.3 | 1.2 | 3.4 | 2.9 | |||
| Grapes | 18.1 | 6.5 | 0.4 | 7.6 | 0.1 | 7.6 | ||
| Guava | 6 | 1.2 | 1.9 | 1 | 0.7 | 2.4 | ||
| Guava, strawberry | 6 | 1.2 | 1.9 | 1 | 2.4 | |||
| High fructose corn syrup (42) | 71 | 36.9 | 29.8 | 2.1 | 29.8 | |||
| High fructose corn syrup (55) | 77 | 30.8 | 42.4 | 2.3 | 42.4 | |||
| High fructose corn syrup (90) | 80 | 7.2 | 72 | 72 | ||||
| Honey | 81.9 | 33.8 | 42.4 | 1.5 | 4.2 | 43.2 | ||
| Honeydew melon | 8.2 | |||||||
| Jackfruit | 8.4 | 1.4 | 1.4 | 5.4 | 4.1 | |||
| Kiwi fruit | 10.5 | 5 | 4.3 | 1.1 | 4.9 | |||
| Lemon | 2.5 | 1 | 0.8 | 0.6 | 1.1 | |||
| Lifesavers | 66.5 | 66.5 | 33.3 | |||||
| Lime | 0.4 | 0.2 | 0.2 | 0.2 | ||||
| Mamey Apple | 6.5 | 1.1 | 3.7 | 1.6 | 4.5 | |||
| Mango | 14.8 | 0.7 | 2.9 | 9.9 | 7.9 | |||
| Maple sugar | 85.2 | 4.3 | 4.3 | 75 | 41.8 | |||
| Molasses | 60 | 11.2 | 12.9 | 34.7 | 30.3 | |||
| Nectarine | 8.5 | 1.2 | 6.2 | 3.1 | ||||
| Orange | 9.2 | 2.2 | 2.5 | 4.2 | 4.6 | |||
| Papaya | 5.9 | 1.4 | 2.7 | 1.8 | 0.4 | 3.6 | ||
| Peach | 8.7 | 1.2 | 1.3 | 5.6 | 4.1 | |||
| Pear | 10.5 | 1.9 | 6.4 | 1.8 | 7.3 | |||
| Pear, Bosc | 10.5 | 1.9 | 6.4 | 1.8 | 7.3 | |||
| Pear, D’Anjou | 10.5 | 1.9 | 6.4 | 1.8 | 7.3 | |||
| Pineapple | 11.9 | 2.9 | 2.1 | 3.1 | 3.7 | |||
| Plum | 7.5 | 2.7 | 1.8 | 3 | 3.3 | |||
| Pomegranate | 10.1 | 5 | 4.7 | 0.4 | 4.9 | |||
| Purple Passion Fruit | 11.2 | 4 | 3.1 | 3.3 | 4.8 | |||
| Raisins | 65 | 31.2 | 33.8 | 33.8 | ||||
| Raisins, Golden | 70.6 | 32.7 | 37.1 | 0.8 | 37.5 | |||
| Raspberries | 9.5 | 3.5 | 3.2 | 2.8 | 1 | 4.6 | ||
| Sorghum syrup | 65.7 | 33.5 | ||||||
| Starfruit | 7.1 | 3.1 | 3.2 | 0.8 | 0.1 | 3.6 | ||
| Strawberries | 5.8 | 2.2 | 2.5 | 1 | 3 | |||
| Sucrose (table sugar) | 97 | 97 | 48.5 | |||||
| Tangerine | 7.7 | |||||||
| Tomato | 2.8 | 1.1 | 1.4 | 1.4 | ||||
| Watermelon | 9 | 1.6 | 3.3 | 3.6 | 5.1 | |||
| Zante currants | 70.6 | 32.7 | 37.1 | 0.8 | 37.5 |
The information on this page was compiled using the Nutritionist V Database.
The Paleo Diet Team
The Paleo Diet® team consists of a group of scientists, journalists, experts, and recipe creators who stay at the forefront of nutrition science.
More About The Author
Learn About the Diet


The Paleo Diet® Newsletter
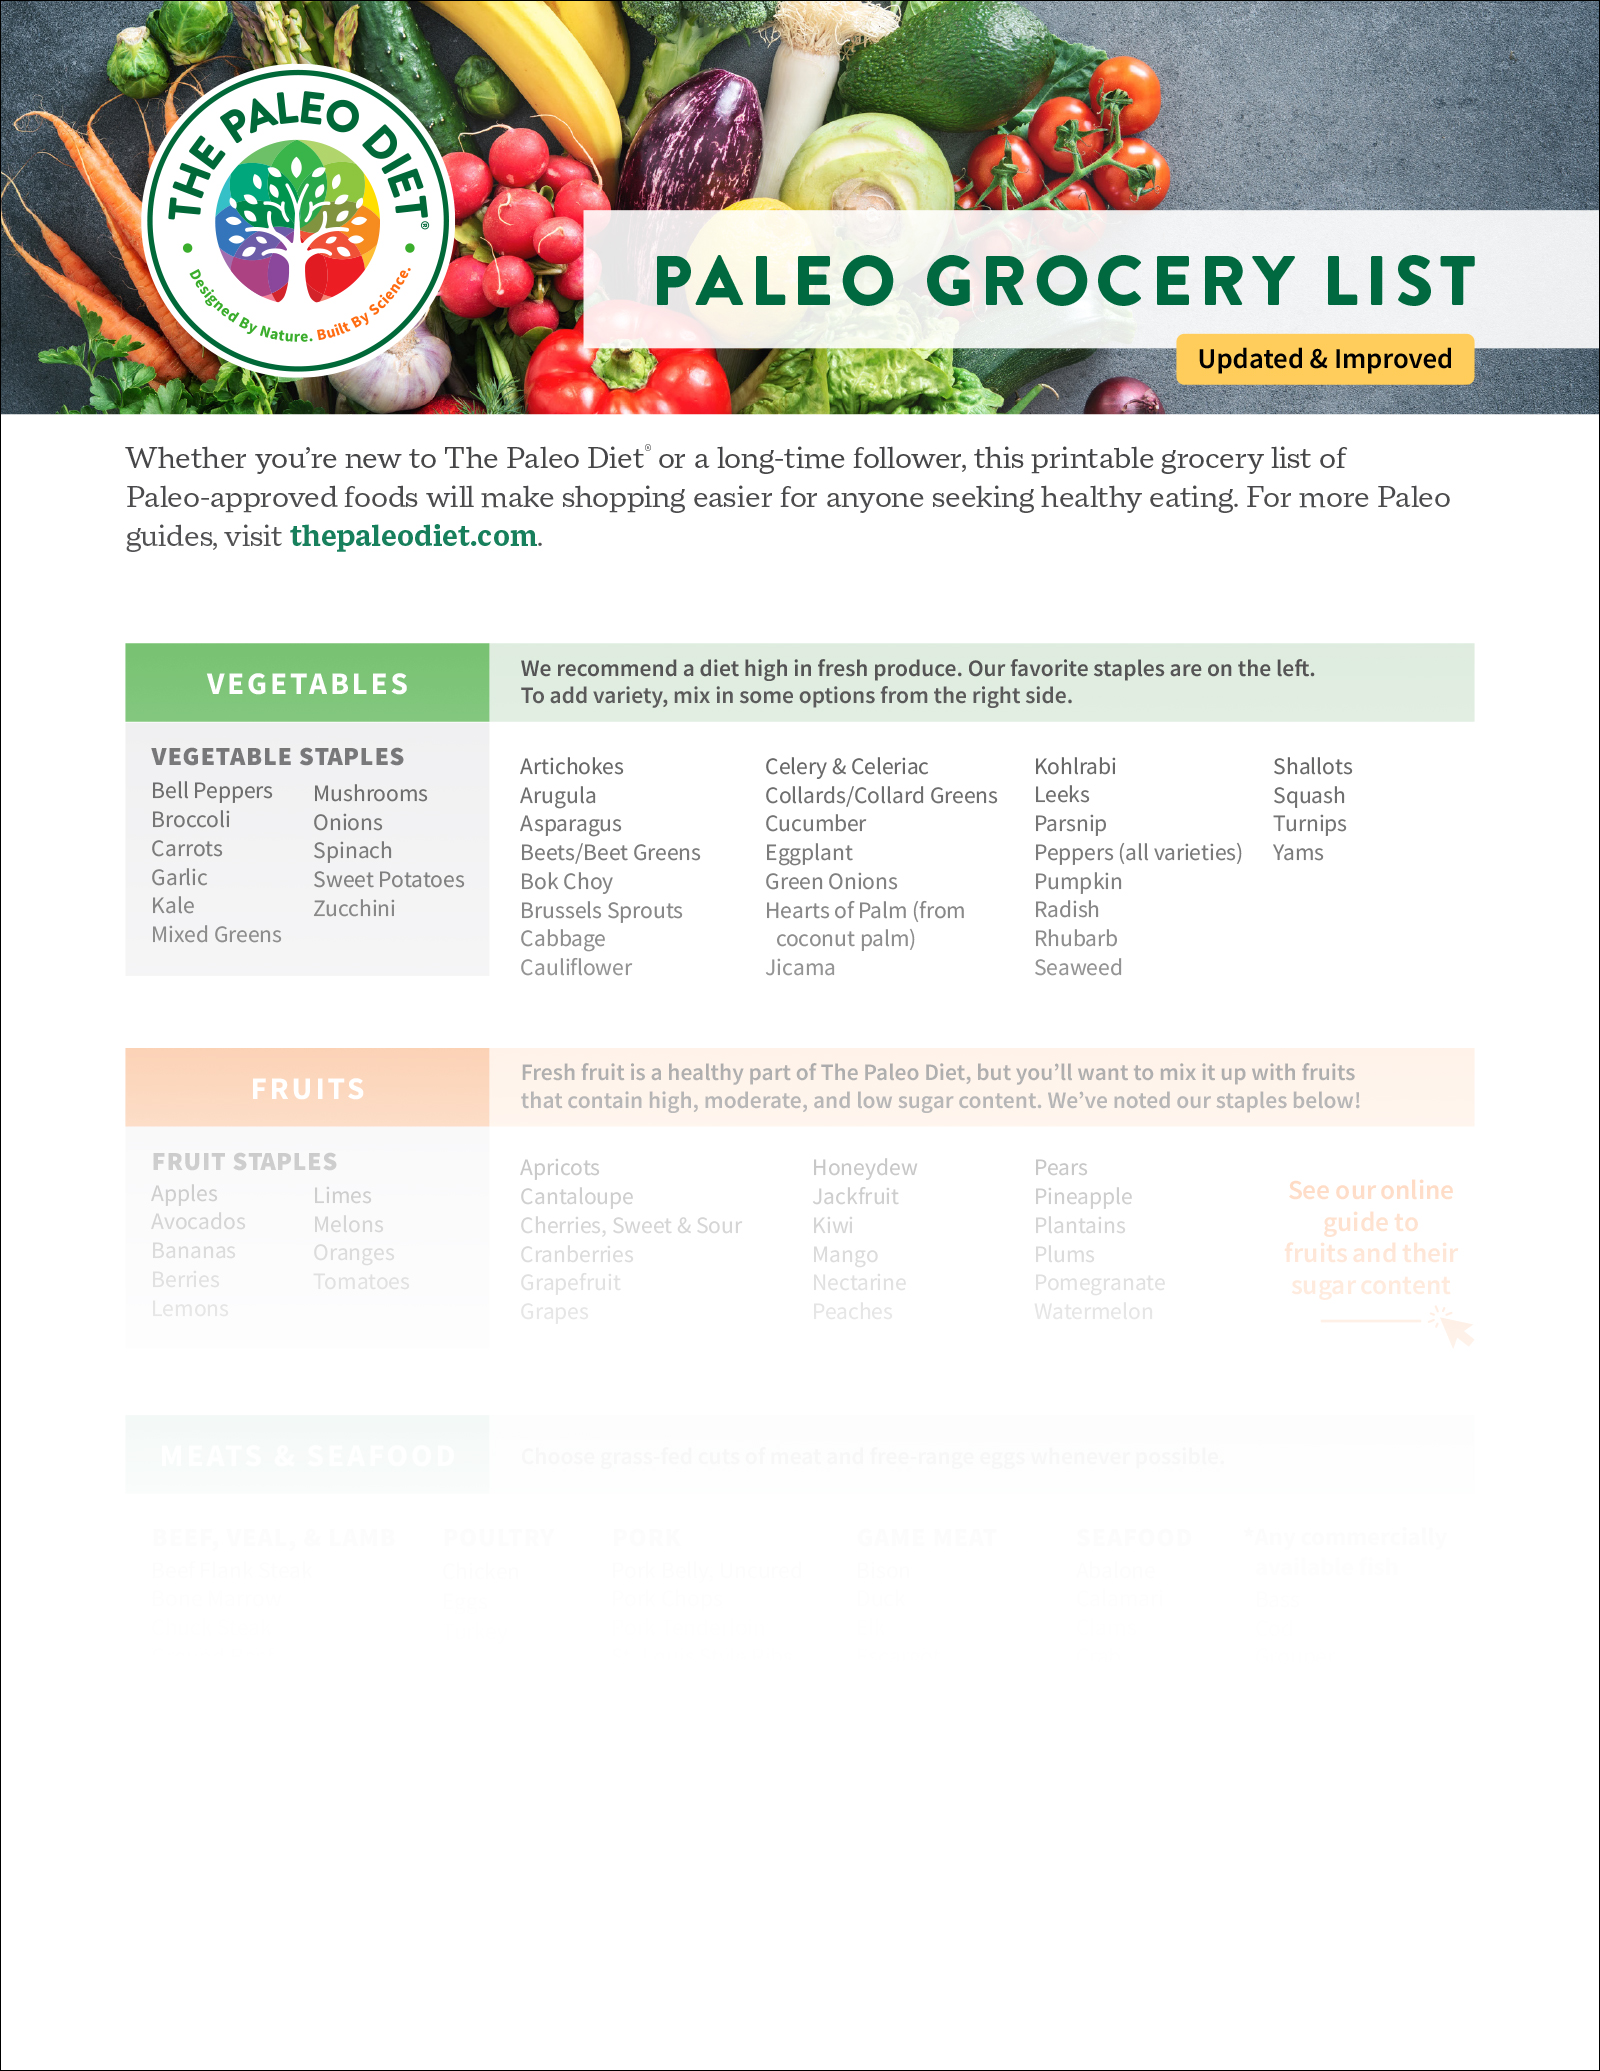
Sign up to get info on healthy nutrition, free recipes, meal prepping, and the latest health research. New subscribers will also receive our Official Paleo Grocery List!